Seasonal Calendar
- Objective: To gain an understanding of women’s versus men’s workloads, livelihood strategies and division of labor as well as gain an understanding of conditions facing poor and very poor households.
- Materials/Preparation: Idea cards with each month written, markers, stones, long grass or sticks or sorghum leaves (as available).
- Participants: Varies according to exercise. In Uganda, the seasonal calendar was conducted with village in the poor and very poor well-being categories.
Steps
Following introductions, facilitators ask – in which month does your year start, and lays cards for each month of the year horizontally, on the ground.
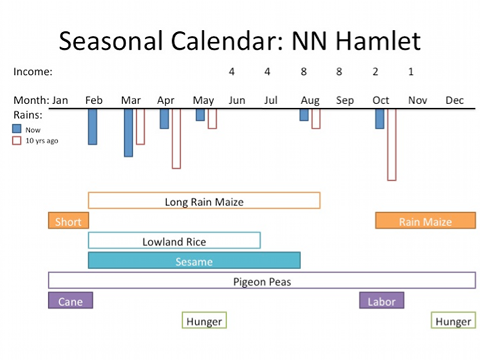
The facilitator then asks in which month does it rain most? And least? Using a sorghum leaf (or sticks, long grass, idea cards or other available material), the facilitator tears the leaf to illustrate the amount of rain and lays it above each month card. Once participants understand the exercise, the facilitator then hands over leaves for participants themselves to lay out the annual rainfall pattern.
The facilitator reviews the rainfall patterns and asks – are there differences in how much it rained 20 years ago in comparison with today? Past rainfall patterns are then also placed on the calendar.
Next Steps - Tanzania |
Next Steps - Uganda |
|
From discussing rainfall, in Tanzania teams then asked:
Each crop is laid out in a matrix, with cards to indicate the months when the crops are in the ground.
Each income earning activity is also laid out on the calendar, by month. Once all agricultural and non-agricultural activities are indicated, the facilitator reviews the matrix and asks for additions. These are also mapped. Then, the facilitator asks:
|
The facilitator starts by placing 10 stones next to the month with the most income, then moves on to the 2nd-highest income month, etc. until all months are covered. Under the months, the research team delineated a number of rows:
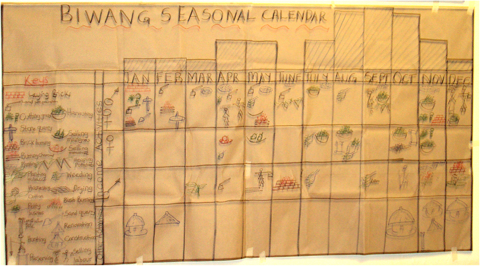
The research team then facilitated a discussion on activities across each season, first by asking which month was the busiest. For that month, participants discussed what type of work was done at that time, where it occurred, and who was responsible for that work (men or women, girls or boys). As the discussion progressed, a member of the team filled out the ideas mentioned and placed them in the appropriate space within the calendar matrix. From that point, the research team facilitated discussion for each month of the year. Once each month was discussed, facilitators then reviewed the completed calendar matrix, and asked if there was any missing. |
Both exercises lead participants to discuss times of scarcity. On the calendar, the facilitation team asks: in months with least income, you still have family to feed and buy basic needs, etc.
- How do you manage with such little income?
- What does it mean for your family?
- What are your strategies to run your household with such little income? (Do you eat the same amount of food? Do you borrow money? Sell assets?) For each coping mechanism:
- What are the terms or conditions of each strategy in these times? (e.g. for borrowing or selling productive assets)?
- Is everyone in the household affected equally by these measures or some more than others?


Variations
Seasonal Calendars of Health Issues
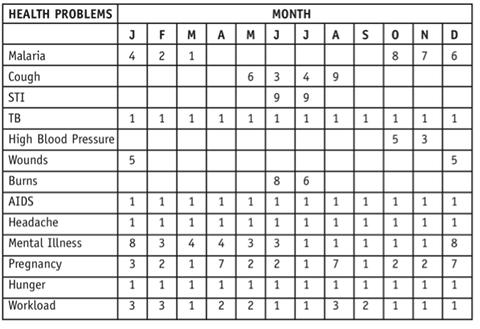
Participants then listed the key health concerns facing them.
The research team then led a discussion on when specific health concerns are more or less prevalent across the year. For each month, participants rate the prevalence of each health issue on a scale of 0 (non-existent) to 10 (very prevalent). Based on the calendar, questions to consider with participants include:
- Were you, as a group, able to easily agree on the seasons of low and high prevalence? What was the source of disagreement?
- What patterns do you see in your seasonal calendar?
- What can you see as the possible reasons for the high prevalence of [health issue] during [month or season]? Now that we have identified season as a factor, what could we do to improve the situation?
- Do you see any differences in the way the problem(s) affects women and men differently during certain seasons? How can you explain this difference?
- What can you do as an individual to address these problems? What can other community members do to address these problems?

Seasonal Calendars in Work with Children
To understand the link between seasonal change and children's lives, the GirlsPLACE Manual (D VanBelle-Prouty and H Sey, 1998) also adapted this exercise for classrooms.
In this version, children use draw a large calendar in months across the floor . Using locally available materials, children then indicate each season in a year (using colored beads, or whatever is available).
- Simlar to above, students start by focusing on the busiest month. The facilitator the leads a discussion on what kind of work boys do, and what kind of work girls, as well as what work both boys and girls do. As activities are identified, students draw or gather materials to symbolize each activity, which is organized in terms of girls' work, boys' work and children's work.
- To explore risks of absentee-ism and other issues facing children, this method can be used to explore seasonal barriers facing children, in terms of food eaten, transport to school or other places, disease as well as as traditional/religious events that may affect school participation.
Related Tools
View more tools related to:
Resources
- B Bode (2010). Regional Capacity-Building Initiative in Situational Analysis. CARE International – East / Central Africa Regional Management Unit.
- B Bode (2009). The Causes and Conditions of Poverty in Acholiland, Northern Uganda. CARE Uganda.
- CARE and ICRW (2006). Walking the Talk. Inner Spaces, Outer Faces Initiative: A Gender and Sexuality Initiative.
- D VanBelle-Prouty and H Sey (1998). Girls' Participatory Learning Activities in the Classroom Environmetn (GirlsPLACE) A View to the Experiences of Girls. Institute for International Research.
